

Revenue, 2025
$18.9 Bn
Forecast, 2035
$308.2 Bn
CAGR, 2025-2035
32.2%
Report Coverage
Global
Market Size and Forecast
2025
$18.9 Bn
2035
$308.2 Bn
CAGR
32.2%
The Global Virtual Tour Market was valued at USD 18.9 billion in 2025 and is projected to reach USD 308.2 billion by 2035, growing at a CAGR of 18.3%. North America led the market with a 49.6% share in 2025, while the U.S. market reached USD 2.2 billion and is expected to grow at a 33.7% CAGR, supported by wider use of immersive 3D tours, 360-degree viewing, VR-enabled property walkthroughs, virtual travel previews, and digital customer engagement tools.
The market expansion is expected to remain strong as businesses adopt virtual tours to improve customer engagement, reduce unnecessary physical visits, and increase buyer confidence. Real estate companies, hotels, educational institutions, event venues, and travel platforms are using these tools to present spaces more clearly and reach wider audiences online. The long-term outlook remains positive as cloud-based platforms, AI-guided tours, VR integration, and digital twin technologies continue to improve the quality and accessibility of virtual tour experiences.
Top Market Takeaways
Software held around 52.5% share in the virtual tour market, supported by rising demand for interactive tour creation tools, 3D visualization platforms, and digital content management solutions.
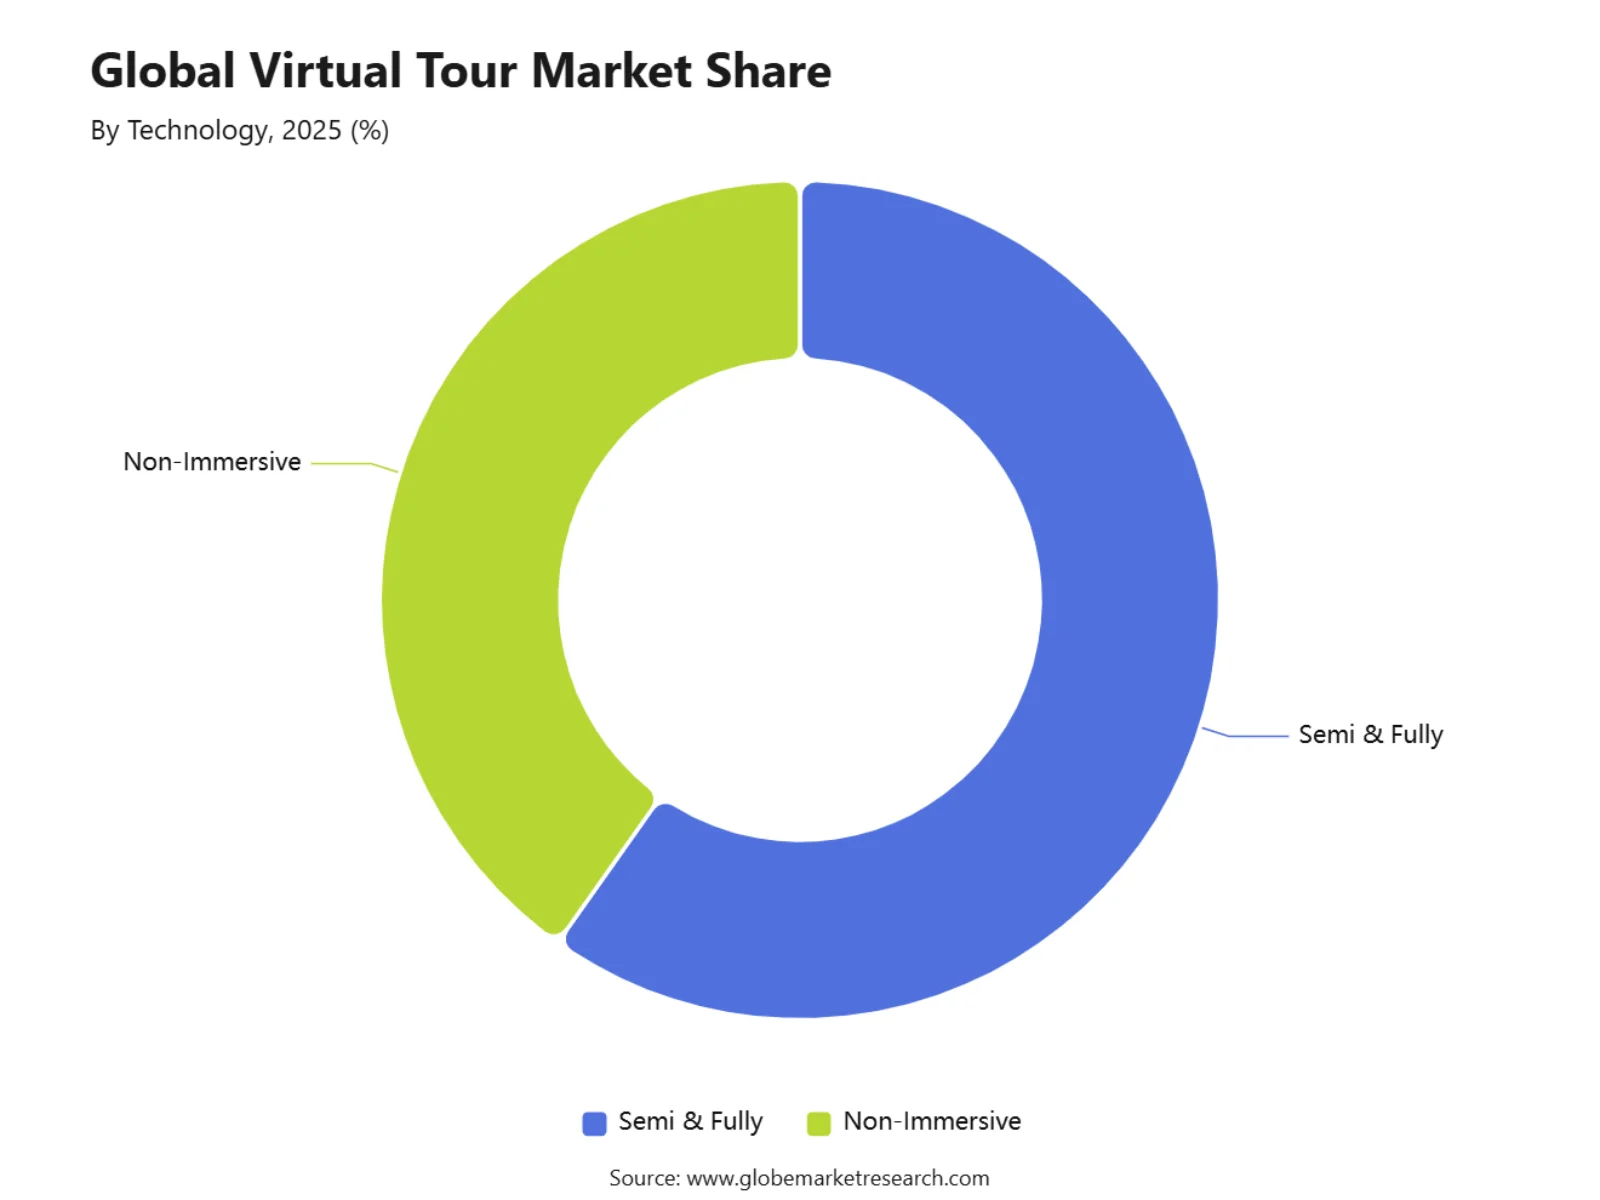
Semi and fully immersive technology led the market with about 59.8% share, driven by growing use of VR-based viewing, 3D walkthroughs, and interactive property experiences.
360-degree video accounted for around 45.2% share in 2025, supported by its wide use in real estate, tourism, education, and commercial space visualization.
Real estate led the application segment with around 47.3% share, driven by rising demand for remote property viewing, digital listings, and immersive buyer engagement.
Cloud-based platforms held about 77.5% share in 2025, supported by easy access, faster deployment, scalable storage, and simple sharing across devices.
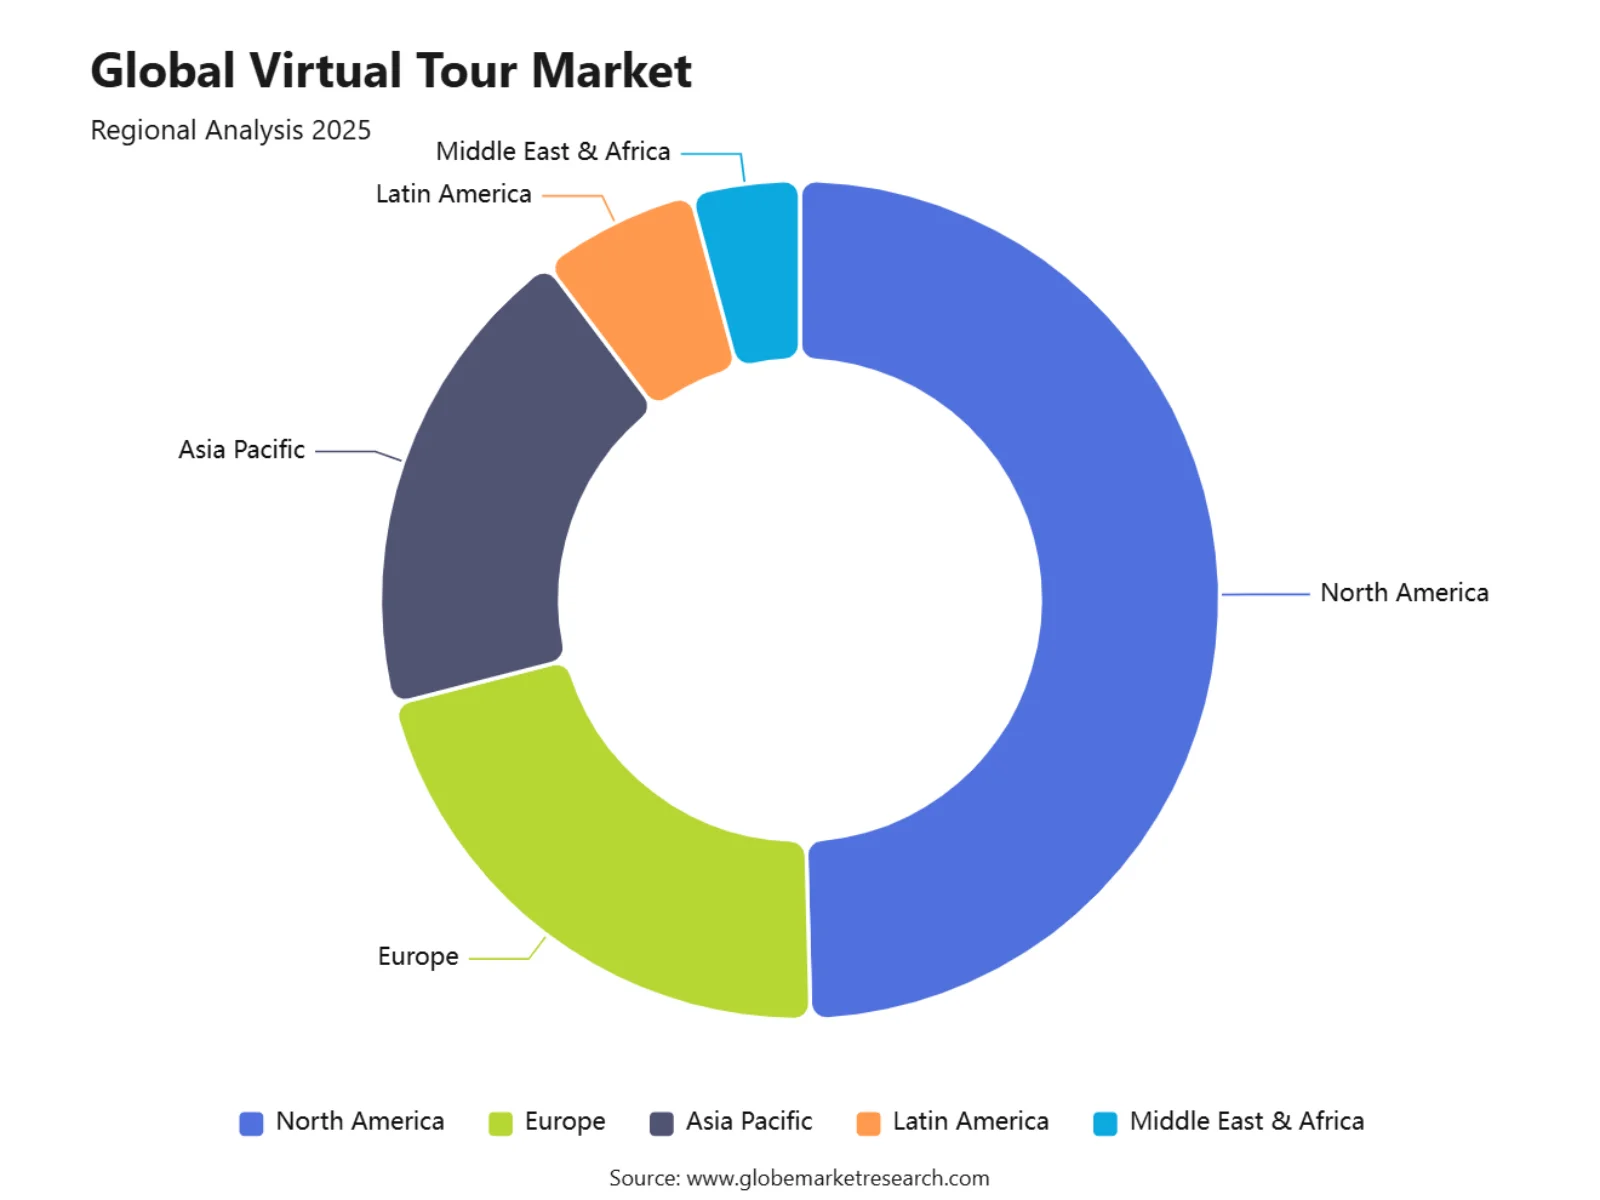
North America led the virtual tour market with 49.6% share, supported by strong adoption across real estate, hospitality, education, and commercial sectors.
The U.S. virtual tour market was valued at USD 2.2 billion and is projected to grow at a CAGR of 33.7%.
Virtual Tour Market Overview
The virtual tour market refers to digital solutions that allow users to explore real spaces through 360-degree images, 3D walkthroughs, virtual reality, augmented reality, video tours, and interactive digital twins. These tools are used in real estate, tourism, hospitality, education, retail, museums, construction, healthcare, and corporate facilities. The growth of the market can be attributed to rising demand for remote viewing, digital customer engagement, and faster decision-making before a physical visit.
Virtual tours are becoming more important because buyers, travelers, students, and business customers now expect visual information before making a decision. In real estate, 88% of U.S. home buyers purchased their home through an agent or broker in 2025, while sellers continued to depend on digital and agent-led marketing to reach serious buyers. This supports demand for visual tools such as 3D tours, property walkthroughs, and virtual listing experiences.
The main growth driver is the shift toward digital-first discovery across real estate, travel, hospitality, education, and retail. Customers now prefer to view properties, hotels, campuses, restaurants, showrooms, and tourist sites online before visiting in person. UN Tourism reported that international tourist arrivals reached about 1.52 billion in 2025, rising 4% from 2024 and adding nearly 60 million more tourists.
Virtual Tour Statistics
87% of homebuyers expect virtual tours on property listings in 2026, showing that digital property viewing has moved from a premium feature to a standard buyer expectation.
Global international tourist arrivals reached 1.52 billion in 2025, increasing 4% from 2024.
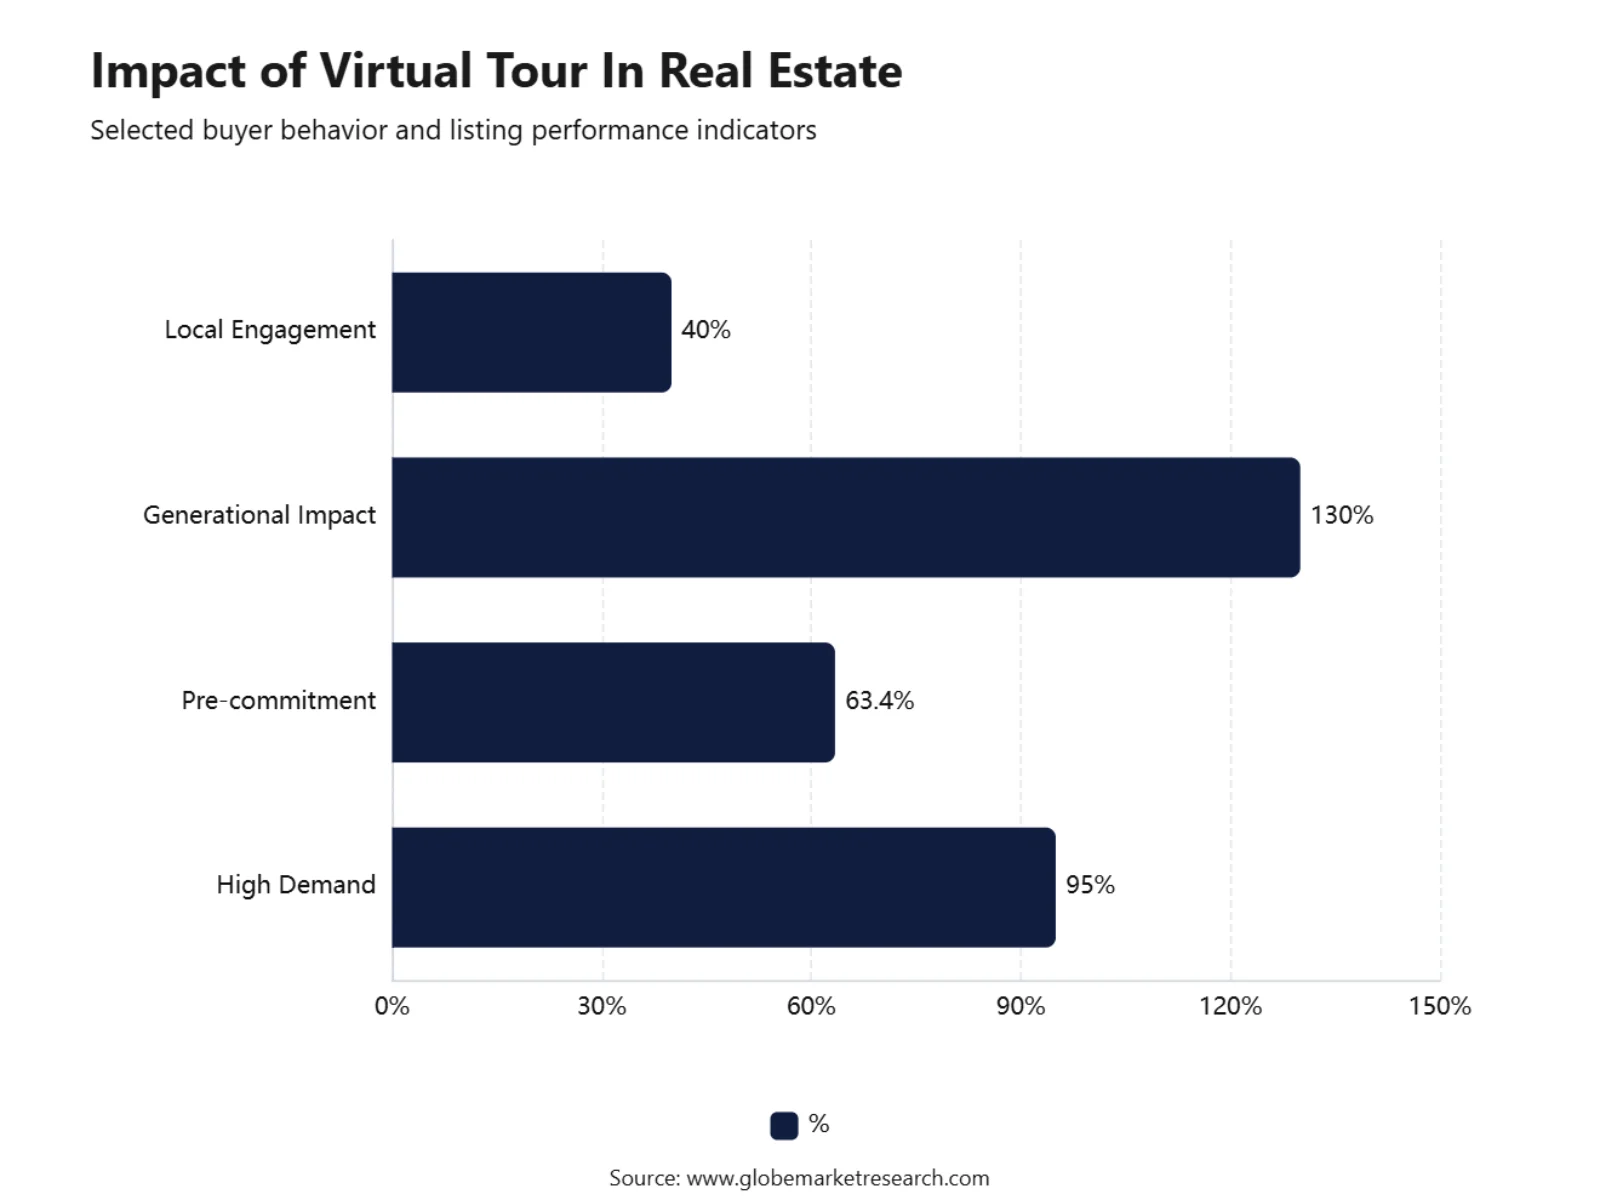
Listings with virtual tours receive 87% more views compared to listings without virtual tours, making them more effective for buyer engagement and listing visibility.
Nearly 60 million more international tourists travelled in 2025 compared with 2024.
Europe remained the largest destination region, with about 793 million international tourist arrivals in 2025.
Asia Pacific recorded about 331 million international tourist arrivals in 2025, supported by regional tourism recovery and stronger travel demand.
Properties with virtual tours sell around 20% faster and may achieve 1% to 3% higher selling prices, as buyers can assess homes more confidently before visiting.
3D virtual tours can help homes sell up to 31% faster, mainly because buyers who visit in person are already more qualified after viewing the property online.
In real estate, 88% of U.S. home buyers purchased their home through an agent or broker in 2025.
In 2025, 91% of U.S. home sellers used a real estate agent, matching the highest percentage on record.
Only 5% of U.S. homes were sold as for-sale-by-owner in 2025, the lowest level on record.
Segment Highlights
By Component: Software
In 2025, Software held around 52.5% share in the Virtual Tour Market, supported by rising demand for 3D tour creation tools, editing platforms, virtual staging systems, hosting solutions, analytics dashboards, and interactive walkthrough software. The segment is gaining traction because businesses want virtual tour tools that can be created, updated, shared, and measured without heavy hardware dependence.
Software also helps companies publish tours across websites, property portals, mobile apps, and social media channels. The shift toward AI-assisted visual processing and real-time rendering is improving the quality of immersive content while reducing production complexity. Recent immersive technology analysis shows that the sector is moving toward easier use on everyday devices rather than depending only on specialised hardware.
By Technology: Semi and Fully Immersive Technology
In 2025, Semi and fully immersive technology led the market with about 59.8% share, driven by stronger demand for realistic property walkthroughs, destination previews, campus tours, training simulations, and product demonstrations. These technologies improve user engagement by allowing viewers to explore spaces in a more interactive and visual format.
The segment is supported by better cameras, 3D capture tools, spatial mapping, browser-based viewing, and headset-compatible experiences. Immersive technology is becoming more practical as platforms focus on visual realism, easier device access, and smoother user experience. This makes semi and fully immersive formats useful across real estate, tourism, education, healthcare, manufacturing, and retail.
 iThe graph shows projected market growth until 2035 based on CAGR analysis. Actual outcomes may vary depending on changing demand, competition, and economic factors.To gain greater insights - request a sample report PDF
By Type: 360-Degree Video
In 2025, 360-degree video accounted for around 45.2% share in 2025, supported by its simple production process and strong compatibility with mobile phones, desktops, websites, and VR headsets. It is widely used because viewers can look around a space from different angles without requiring complex navigation.
The format is popular in real estate, hospitality, travel, museums, education, and event promotion. It allows businesses to present locations clearly and helps users understand space, layout, and surroundings before making a visit or purchase decision. Its lower production cost compared with advanced 3D modelling also makes it suitable for small businesses and property owners.
By Application: Real Estate
In 2025, Real estate led the Virtual Tour Market with around 47.3% share, as property buyers, tenants, brokers, and developers increasingly use digital walkthroughs to review spaces remotely. Virtual tours help reduce unnecessary site visits, improve listing quality, and give buyers a clearer view of floor plans, room flow, and property condition.
The segment is also supported by the use of AI and 3D tools in property marketing. A 2025 academic study introduced a virtual real estate agent system using more than 1,200 house-tour videos with camera poses, 3D reconstructions, and real estate descriptions, showing how automated tour creation is advancing in the property sector.
 iThe graph shows projected market growth until 2035 based on CAGR analysis. Actual outcomes may vary depending on changing demand, competition, and economic factors.To gain greater insights - request a sample report PDF
By Platform and Deployment: Cloud-Based Platforms
In 2025, Cloud-based platforms held about 77.5% share in 2025, supported by easy storage, remote access, faster sharing, and smooth integration with property portals, websites, customer relationship tools, and marketing platforms. Cloud deployment allows users to host virtual tours, update content, manage access, and track engagement without maintaining large local systems.
The segment is also aligned with broader enterprise cloud adoption. Flexera’s 2026 State of the Cloud findings showed that 71% of organizations operated a Cloud Center of Excellence, while 63% had established FinOps teams, reflecting the wider shift toward managed cloud operations. This supports the use of cloud-based virtual tour platforms for scalable content hosting and digital experience delivery.
By Regional Analysis: North America
In 2025, North America led the Virtual Tour Market with 49.6% share, supported by high digital adoption, strong real estate technology use, advanced cloud infrastructure, and mature online property search behavior. The region has strong demand from real estate, tourism, higher education, retail, and commercial property sectors.
Impact Factor | Estimated CAGR Impact | Regional Relevance | Market Impact |
|---|---|---|---|
North America technology leadership | +4.8% | U.S. and Canada | Leads platform adoption. |
Europe tourism and cultural adoption | +3.6% | UK, Germany, France, Italy, Spain | Supports destination tours. |
Asia Pacific digital expansion | +4.2% | China, India, Japan, South Korea, Southeast Asia | Driven by mobile adoption. |
Middle East hospitality investment | +3.0% | UAE, Saudi Arabia, Qatar | Supports premium tourism. |
Latin America emerging adoption | +2.2% | Brazil, Mexico, Chile, Colombia | Shows growth potential. |
The U.S. market was valued at USD 2.2 Bn and is projected to grow at a CAGR of 33.7%. Growth in the country is supported by rising use of virtual walkthroughs in real estate listings, commercial leasing, hotel marketing, campus tours, and remote customer engagement. The large base of cloud users and digital-first property buyers continues to support adoption across the U.S. market.
 iThe graph shows projected market growth until 2035 based on CAGR analysis. Actual outcomes may vary depending on changing demand, competition, and economic factors.To gain greater insights - request a sample report PDF
Key Market Segments
By Component
Software
Hardware
Services
By Technology
Semi & Fully Immersive
Non-Immersive
By Type
360-Degree Video
3D Virtual Tours
Interactive Virtual Tours
By Application
Real Estate
Tourism & Hospitality
Art Galleries & Museums
Education
Retail
Others
By Platform / Deployment
Cloud-Based
On-Premise
By Region
North America
Europe
Asia Pacific
Latin America
Middle East & Africa
Market Dynamics
Drivers Impact Analysis
Impact Factor | Estimated CAGR Impact | Regional Relevance | Market Impact |
|---|---|---|---|
Rising adoption in real estate | +4.6% | North America, Europe, Asia Pacific | Improves property viewing access. |
Growth in virtual tourism | +3.8% | Europe, Asia Pacific, Middle East | Expands remote destination discovery. |
Increasing use in education and training | +3.2% | U.S., Europe, India, China | Supports immersive learning. |
Demand for 360-degree video content | +3.5% | Global | Enhances digital engagement. |
Expansion of cloud-based virtual tour platforms | +3.0% | Global | Improves platform scalability. |
Restraints Impact Analysis
Impact Factor | Estimated CAGR Impact | Regional Relevance | Market Impact |
|---|---|---|---|
High content production cost | -2.1% | Emerging markets, SMEs | Limits small business adoption. |
Limited VR device penetration | -1.8% | Asia Pacific, Latin America, MEA | Slows immersive experience usage. |
Low digital readiness among users | -1.5% | Rural areas, developing economies | Restricts platform adoption. |
Technical quality issues | -1.3% | Global | Affects user experience. |
Data privacy and security concerns | -1.1% | North America, Europe, developed Asia | Raises compliance pressure. |
Opportunities Impact Analysis
Impact Factor | Estimated CAGR Impact | Regional Relevance | Market Impact |
|---|---|---|---|
Expansion in real estate marketing | +4.4% | U.S., Canada, UK, India, UAE | Supports property sales conversion. |
Growth in hospitality and travel promotion | +3.7% | Europe, Asia Pacific, Middle East | Improves destination marketing. |
Adoption in museums and cultural sites | +3.1% | Europe, North America, Asia Pacific | Expands digital visitor reach. |
Use in retail and showroom experiences | +3.0% | U.S., Europe, China, Japan | Enhances product discovery. |
Rising demand for metaverse-ready content | +2.8% | North America, Europe, East Asia | Creates immersive content demand. |
Challenges Impact Analysis
Impact Factor | Estimated CAGR Impact | Regional Relevance | Market Impact |
|---|---|---|---|
Lack of skilled content creators | -1.6% | Emerging markets | Limits quality production. |
Platform integration challenges | -1.4% | Enterprises, real estate, tourism | Delays deployment. |
Slow adoption by traditional businesses | -1.5% | SMEs, offline-first sectors | Reduces market penetration. |
Device and bandwidth limitations | -1.7% | Rural markets, developing regions | Affects smooth viewing. |
Content update and maintenance cost | -1.2% | Global | Increases operating burden. |
Recent Developments
March 2026 – Zillow upgraded Zillow 3D Home tours and interactive floor plans with AI image processing and improved navigation. The update focused on better lighting, sharper visual detail, and more natural room-to-room movement. This strengthens the role of AI-enhanced virtual tours in real estate buyer engagement.
March 2026 – 3DVista released its 2026.0 Total VR Mode update. The upgrade added stronger VR support, complete e-learning functions, skins, and new actions inside VR Mode. This supports demand for virtual tours in training, education, tourism, and enterprise simulation use cases.
December 2025 – Kuula launched a major update to its Create Tour experience. The update added background processing, improved drag-and-drop reordering, and support for images up to 32K resolution. This improves workflow speed and visual quality for real estate, architecture, construction, galleries, and education users.
Report Scope
Report Highlights | Details |
|---|---|
Market Revenue (2025) | USD 18.9 Bn |
Forecast Revenue (2035) | USD 308.2 Bn |
CAGR (2025-2035) | 18.3% |
Base Year for Estimation | 2025 |
Historic Data | 2020-2024 |
Forecast Period | 2025-2035 |
Report Coverage | AI impact Analysis, Revenue projections, company positioning, competitive analysis, growth drivers, and emerging market trends |
Segments Covered | By Component (Software, Hardware, Services), By Technology (Semi & Fully Immersive, Non-Immersive), By Type (360-Degree Video, 3D Virtual Tours, Interactive Virtual Tours), By Application (Real Estate, Tourism & Hospitality, Art Galleries & Museums, Education, Retail, Others), By Platform / Deployment (Cloud-Based, On-Premise), By Regional Insights |
Regional Analysis | North America – US, Canada; Europe – Germany, France, The UK, Spain, Italy, Russia, Netherlands, Rest of Europe; Asia Pacific – China, Japan, South Korea, India, New Zealand, Singapore, Thailand, Vietnam, Rest of Latin America; Latin America – Brazil, Mexico, Rest of Latin America; Middle East & Africa – South Africa, Saudi Arabia, UAE, Rest of MEA |
Key companies profiled | Matterport Inc., Kuula LLC, CloudPano, EyeSpy360, Concept3D Inc., Roundme Limited, 3DVista, iStaging, Zillow 3D Home, Pano2VR, TourWizard, VPIX 360, SeekBeak, Realvision, InsideMaps, Metareal, Virtually Anywhere, Vieweet, Immoviewer, Real Tour Vision, Blue Raven Studios, 360 Imagery, Pan 3Sixty, Starts360, MI 360 |
Customization Scope | Tailored insights for specific regions, countries, and market segments can be provided. Additional report customization is available upon request. |
Competitive Landscape
The market is characterized by intense competition among established players and emerging companies. Strategic partnerships, mergers and acquisitions, and product innovation are key strategies employed by market participants.
Meet the Team
This report was prepared by our expert analysts with deep industry knowledge and research experience.
Kevin is a market research analyst with expertise in industry analysis, market sizing, competitive benchmarking, and growth opportunity assessment. Her work focuses on delivering clear, data-backed insights that help businesses understand market trends, customer demand, emerging technologies, and investment potential across global industries.
Suraj is a seasoned Senior Management Consultant with over 7 years of experience in market research, business strategy, and consulting. He has worked with Fortune 500 companies as well as emerging startups, supporting clients in cross-border expansion, market entry strategies, and growth planning. He has played a key role in delivering strategic viewpoints and actionable insights across various client projects. His expertise includes demand analysis, competitive analysis, market opportunity assessment, channel partner identification, and business expansion strategy. His analytical approach and industry understanding help clients make informed decisions and enter new markets with greater confidence.
Frequently Asked Questions
Related Reports
More in Smart Technologies
Comic Book Subscription Service Market to hit USD 7.8 Bn by 2035
Global Comic Book Subscription Service Market By Subscription Type (Digital Subscription, Physical Subscription, Hybrid Subscription), By Content Type (Superhero Comics, Manga,Indie Comics, Graphic Novels), By Target Audience (Children, Teens, Adults, Collectors), By Pricing Model (Monthly Subscription, Annual Subscription, Pay-Per-Comic), By Regional Insights, Leading Companies and Growth Forecasts By 2025-2035
Esports Market to Surpass USD 84.0 Billion by 2035
Global Esports Market By Revenue Model (Sponsorship, Advertising, Media Rights, Merchandise & Tickets, Publisher Fees, Others), By Platform (PC-Based Esports, Mobile & Tablet Esports, Console-Based Esports), By Streaming Type (Live Streaming, Video-on-Demand), By Audience Type (Casual Viewers, Esports Enthusiasts, Professional Players, Amateur Players), By End User (Game Publishers, Tournament Organizers, Esports Teams, Streaming Platforms, Advertisers & Sponsors, Fans), By Regional Insights, Leading Companies and Growth Forecasts By 2025-2035