

Revenue, 2025
$22.1Bn
Forecast, 2035
$829.8Bn
CAGR, 2025-2035
43.7%
Report Coverage
Global
Market Size and Forecast
2025
$22.1Bn
2035
$829.8Bn
CAGR
43.7%
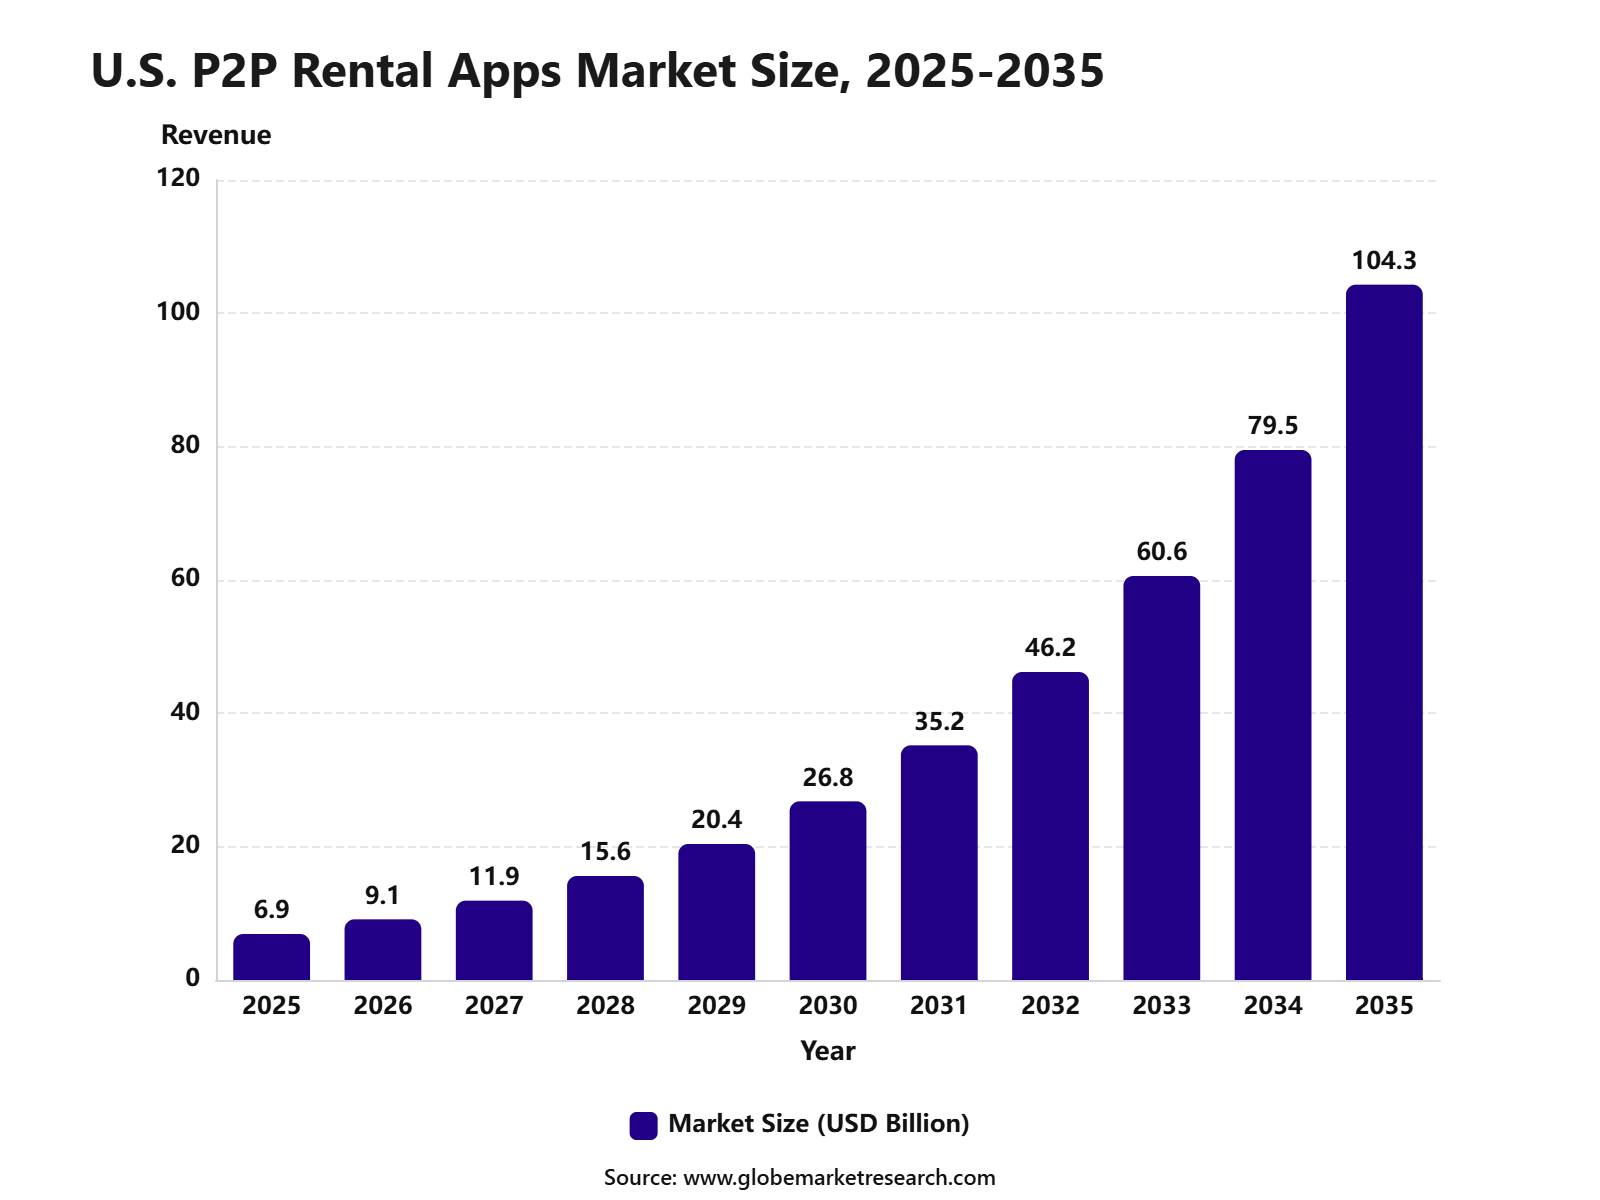
The Global P2P Rental Apps Market was valued at USD 22.1 billion in 2025 and is projected to reach USD 829.8 billion by 2035, growing at a CAGR of 43.7%. North America led the market with a 35.6% share in 2025, while the U.S. market reached USD 6.9 billion and is expected to grow at a 31.2% CAGR, supported by rising use of digital rental platforms, higher consumer preference for access-based ownership, and growing demand for short-term rentals across housing, vehicles, equipment, fashion, electronics, and household goods.
The market growth is supported by strong digital adoption and rising use of mobile-first services. In 2025, over 5.6 billion people used the internet worldwide, creating a large base for app-based rental platforms. Demand is increasing as consumers look for cost savings, flexible access, extra income from underused assets, and more sustainable consumption. Urban users, students, and small businesses are expected to drive continued use across accommodation, mobility, local services, and equipment-sharing rentals.
Key Takeaways
The property rental segment dominated the market with 70.8% share, supported by rising demand for short-term accommodations and flexible rental solutions.
Mobile apps remained the leading platform with 66.2% share, driven by convenience, real-time booking, and user-friendly interfaces.
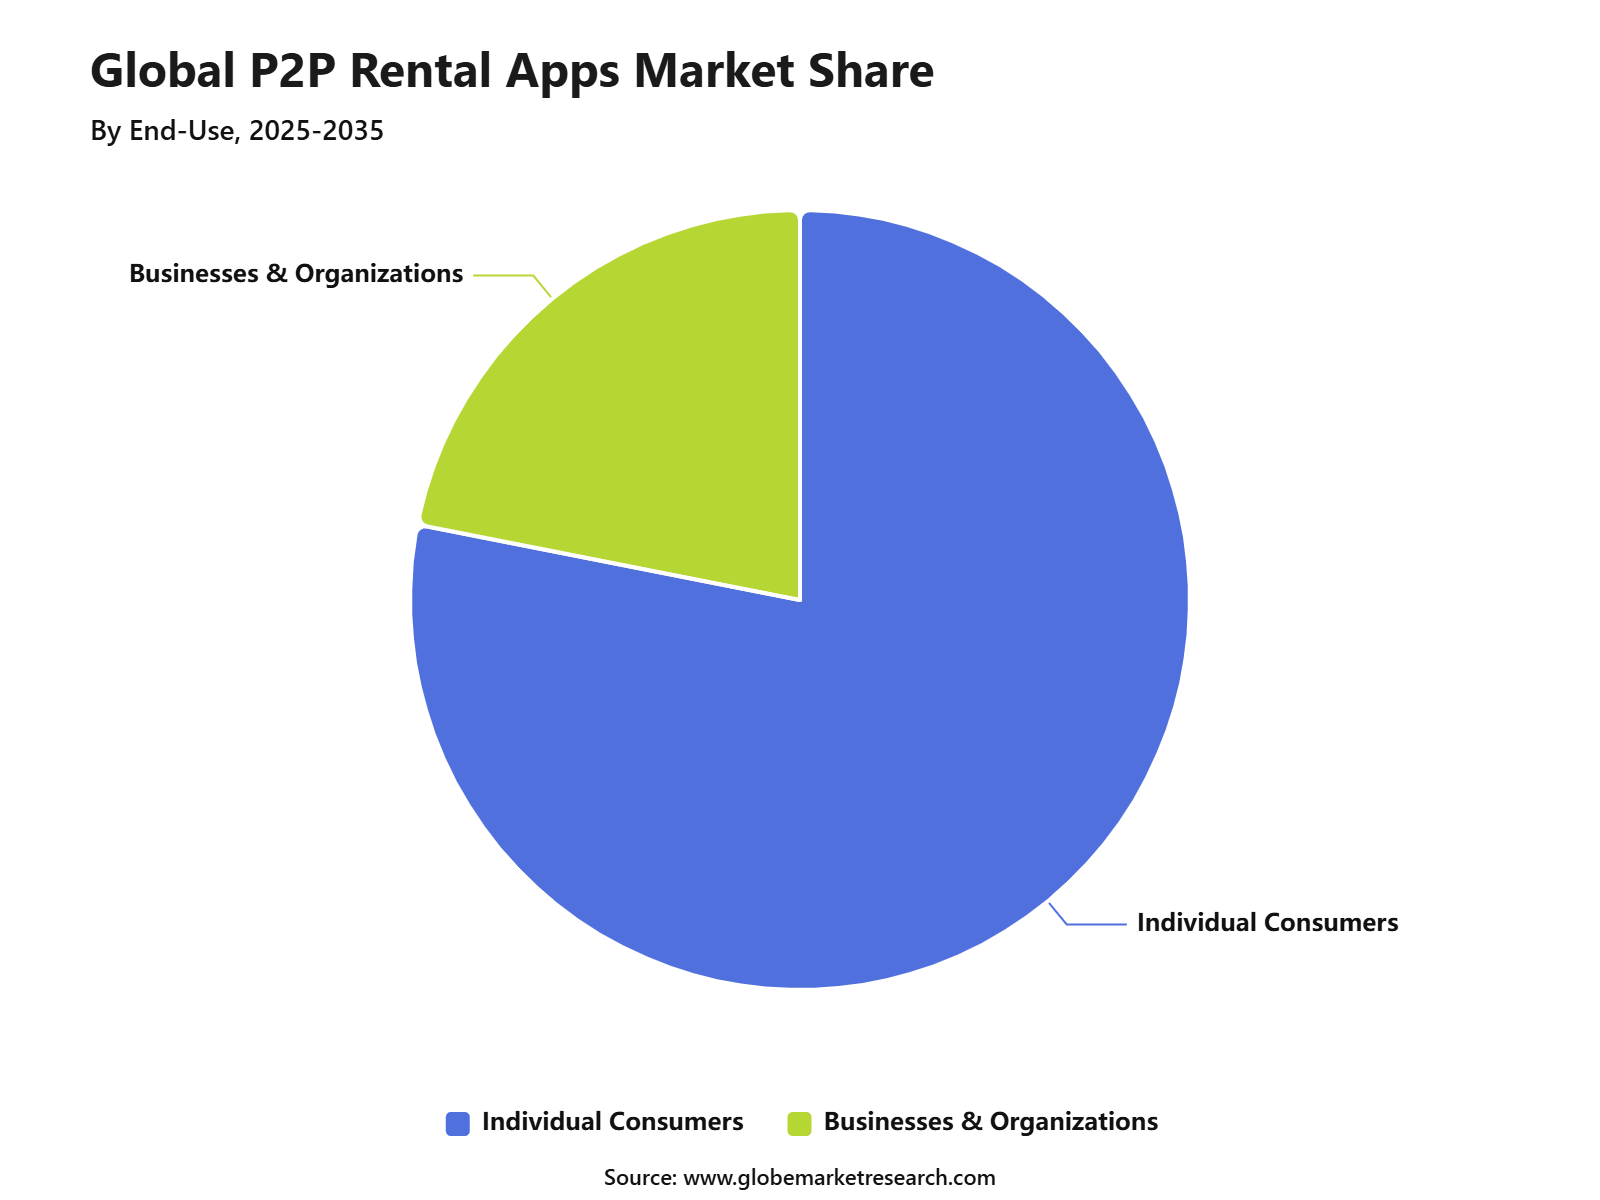
Individual consumers represented the largest end-use segment with 78.1% share, supported by growing preference for peer-to-peer rentals over traditional services.
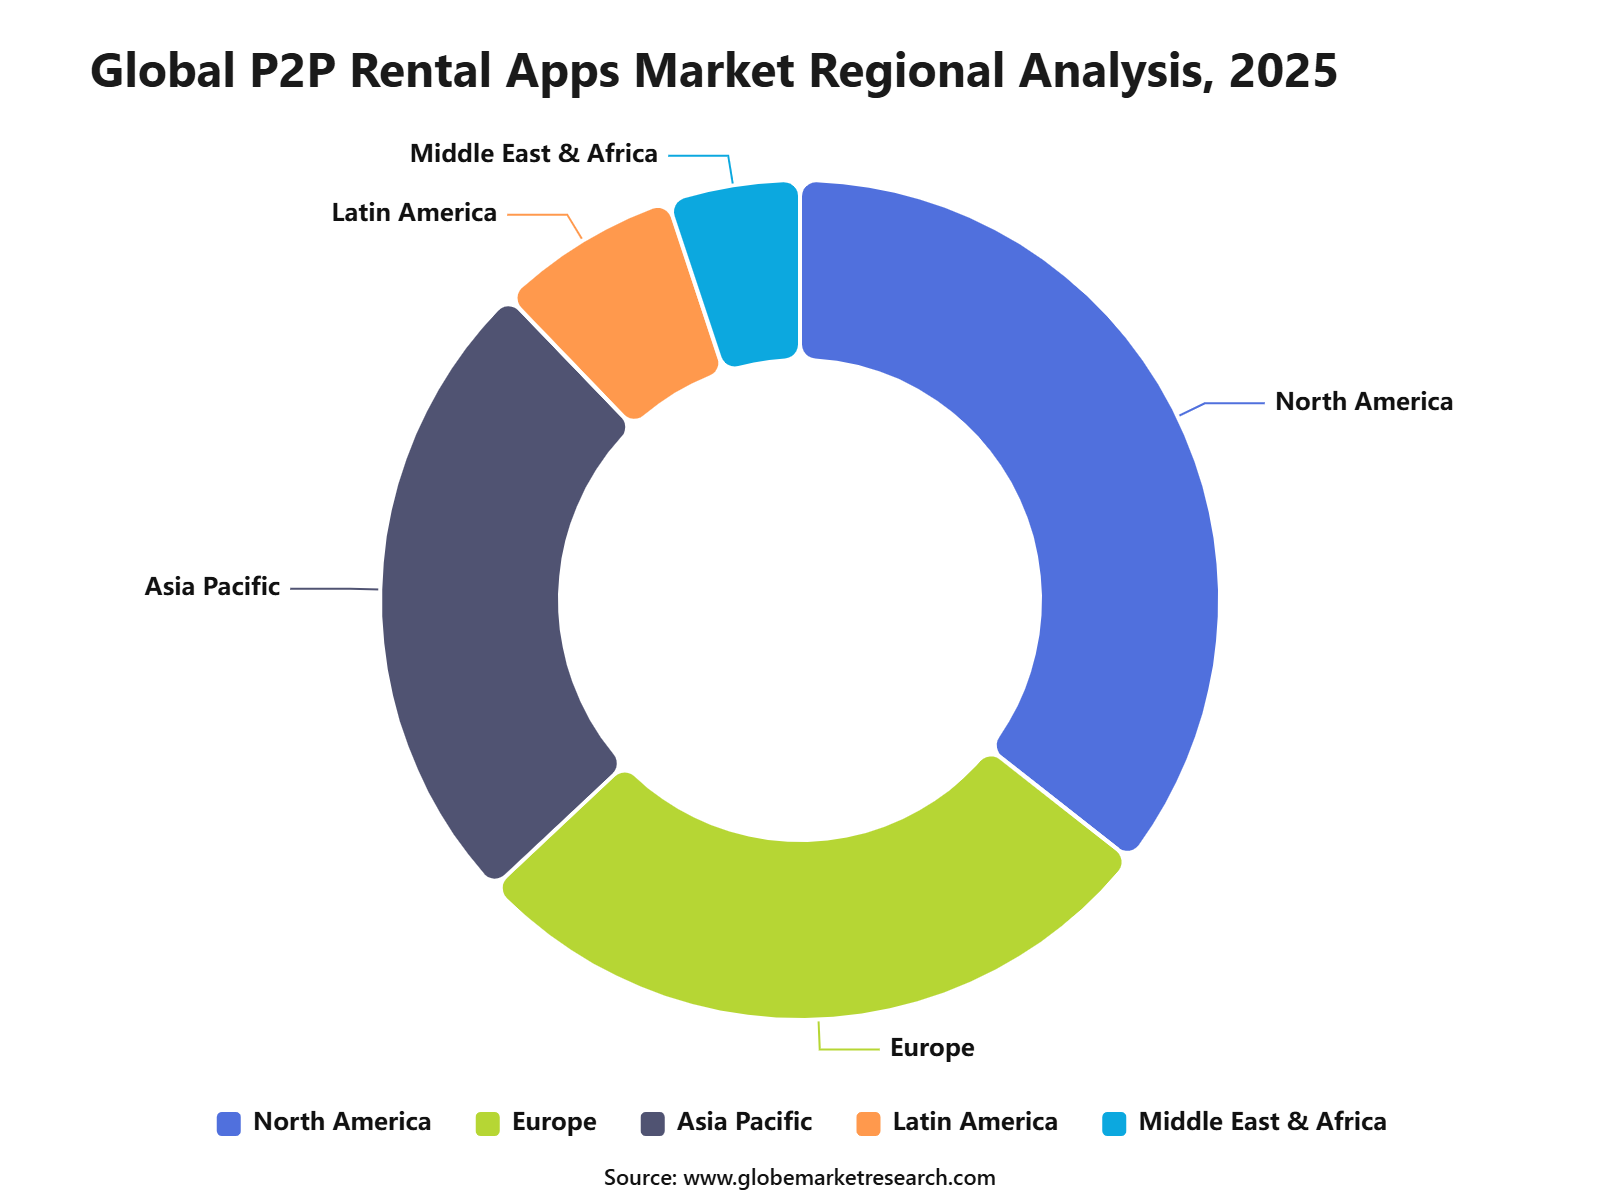
North America accounted for 35.6% share of the market, supported by strong urban rental demand and digital adoption.
The U.S. P2P rental apps market was valued at USD 6.9 billion and is projected to grow at a CAGR of 31.2%.
Market Overview
The P2P rental apps market refers to digital platforms that allow individuals to rent assets such as homes, vehicles, tools, equipment, furniture, and other items directly from other users. The market is growing because consumers are becoming more comfortable with access-based use instead of full ownership. Higher living costs, urban lifestyles, smartphone use, and secure digital payments are supporting the demand for peer-to-peer rental services. Platforms such as home-sharing and car-sharing apps show how underused assets can be converted into income-generating resources.
The market is also supported by strong activity in the wider sharing economy. Airbnb reported continued growth in 2025, with higher bookings and stronger international demand across regions such as Asia Pacific and Latin America. Reuters reported that Airbnb’s Q2 2025 gross booking value reached USD 23.5 billion , rising 11% , while nights and seats booked increased 7% . Turo also reported that it closed 2024 with 3.5 million active guests, 140,000 active hosts, and 340,000 active vehicles, showing the growing scale of peer-to-peer car rental platforms.
By Rental Type: Property Rental
The property rental segment dominated the P2P Rental Apps Market with 70.8% share. This segment is supported by strong use of app-based platforms for short-term stays, vacation homes, shared rooms, serviced apartments, and flexible accommodation bookings. Property rentals remain the largest category because users can compare locations, prices, amenities, reviews, and booking terms in one digital journey.
Demand is also being shaped by the steady recovery of travel and the wider acceptance of peer-hosted accommodation. Airbnb reported that its nights and seats booked rose 10% in Q4 2025, while gross booking value grew 16% year over year, reflecting continued demand for digital booking models. This trend supports the strong role of property rentals in peer-to-peer rental platforms.
By Platform: Mobile Apps
Mobile apps remained the leading platform with 66.2% share. Their strong position is linked to real-time search, map-based discovery, instant booking, secure payments, in-app messaging, push notifications, and user reviews. For P2P rental platforms, mobile apps make the rental process faster because users can complete search, verification, payment, and booking management from one device.
The mobile-first trend is supported by high smartphone adoption. Pew Research Center reported in November 2025 that 91% of U.S. adults own a smartphone, while 98% own a cellphone of some kind. Airbnb also stated that app-booked nights increased 20% year over year in Q4 2025, showing the growing role of mobile usage in digital rental activity.
By End-Use: Individual Consumers
Individual consumers represented the largest end-use group with 78.1% share. This demand is driven by people renting homes, rooms, vehicles, tools, equipment, clothing, event items, and lifestyle products for short-term personal use. The segment benefits from affordability, convenience, and the ability to access assets without long-term ownership.
Consumer adoption is also supported by digital payments and higher comfort with online transactions. The World Bank has reported that more than two-thirds of adults worldwide were making or receiving digital payments by the end of 2021, which created a strong base for app-based rental transactions. This payment behaviour supports smoother booking, refunds, deposits, and service fee collection across P2P rental platforms.
 iThe graph shows projected market growth until 2035 based on CAGR analysis. Actual outcomes may vary depending on changing demand, competition, and economic factors.To gain greater insights - request a sample report PDF
By Regional Analysis: North America
North America captured 35.6% share of the P2P Rental Apps Market. The region benefits from mature digital booking behavior, high internet access, strong payment infrastructure, and broad acceptance of sharing-based services. Demand is visible across vacation rentals, mobility access, equipment sharing, and peer-based consumer services.
The regional market is further supported by a large base of app-ready consumers and established online transaction habits. Strong tourism activity, urban rental demand, and consumer preference for flexible access models continue to support platform growth across the U.S. and Canada. These factors make North America one of the most active markets for P2P rental apps.
 iThe graph shows projected market growth until 2035 based on CAGR analysis. Actual outcomes may vary depending on changing demand, competition, and economic factors.To gain greater insights - request a sample report PDF
Regional Impact Analysis
Impact Factor | Estimated CAGR Impact | Regional Relevance | Market Impact |
|---|---|---|---|
North America market leadership | +11.2% | U.S. and Canada | Leads app-based rentals. |
Europe sharing economy adoption | +9.4% | UK, Germany, France, Spain, Netherlands | Supports regulated growth. |
Asia Pacific rapid expansion | +10.7% | China, India, Japan, South Korea, Southeast Asia | Drives large-scale adoption. |
Latin America emerging demand | +7.1% | Brazil, Mexico, Chile, Colombia | Builds digital rental usage. |
Middle East and Africa early adoption | +6.4% | UAE, Saudi Arabia, South Africa, Nigeria | Shows future growth potential. |
The U.S. P2P Rental Apps Market was valued at USD 6.9 billion and is expected to grow at a 31.2% CAGR in 2025. Growth is supported by strong smartphone ownership, large domestic travel demand, high digital payment usage, and consumer familiarity with rental platforms. The country remains a key market for property rentals, peer-based vehicle access, tools, equipment, and short-term lifestyle rentals.
The U.S. market is also supported by strong platform participation from both renters and asset owners. Reuters reported that the U.S. accounted for about 30% of Airbnb’s total bookings in Q1 2025, while global bookings reached 143.1 million during the quarter. This shows the country’s important role in digital rental demand, even as platform performance can vary with travel spending and economic conditions.
 iThe graph shows projected market growth until 2035 based on CAGR analysis. Actual outcomes may vary depending on changing demand, competition, and economic factors.To gain greater insights - request a sample report PDF
Key Market Segments
By Rental Type
Property Rental
Vehicle Rental
Tools & Machinery
Others
By Platform
Mobile Apps
Web-based Platform
By End-Use
Individual Consumers
Businesses & Organizations
By Regional
North America
Europe
Asia Pacific
Latin America
Middle East and Africa
Drivers Impact Analysis
Impact Factor | Estimated CAGR Impact | Regional Relevance | Market Impact |
|---|---|---|---|
Rising adoption of sharing economy models | +10.8% | North America, Europe, Asia Pacific | Expands peer-to-peer rental usage. |
Growth in mobile app-based rentals | +10.2% | Global | Improves rental access and convenience. |
Increasing demand for affordable asset access | +9.5% | Global, price-sensitive markets | Reduces ownership dependency. |
Rising urban population and flexible lifestyles | +8.7% | U.S., Europe, India, China, Southeast Asia | Supports short-term rental demand. |
Expansion of digital payments and verification tools | +8.1% | Global | Improves transaction trust. |
Restraints Impact Analysis
Impact Factor | Estimated CAGR Impact | Regional Relevance | Market Impact |
|---|---|---|---|
Trust and safety concerns | -5.8% | Global | Slows user adoption. |
Regulatory restrictions on rentals | -5.1% | U.S., Europe, Asia Pacific | Limits platform expansion. |
Risk of asset damage or misuse | -4.6% | Global | Raises insurance and dispute costs. |
Low awareness in emerging markets | -4.0% | Latin America, Africa, rural Asia Pacific | Delays market penetration. |
Platform service fee sensitivity | -3.5% | Price-sensitive users | Affects repeat usage. |
Opportunities Impact Analysis
Impact Factor | Estimated CAGR Impact | Regional Relevance | Market Impact |
|---|---|---|---|
Expansion of property rental apps | +10.5% | North America, Europe, Asia Pacific | Drives high-value transactions. |
Growth in vehicle and mobility rentals | +9.6% | U.S., Europe, China, India | Expands urban rental demand. |
Rising demand for tools and equipment rentals | +8.8% | North America, Europe, Australia | Supports occasional-use assets. |
Adoption among businesses and organizations | +8.2% | Global | Opens B2B rental demand. |
Growth in insurance-backed rental models | +7.5% | North America, Europe, Asia Pacific | Improves user confidence. |
Challenges Impact Analysis
Impact Factor | Estimated CAGR Impact | Regional Relevance | Market Impact |
|---|---|---|---|
User verification and fraud risks | -5.4% | Global | Affects platform trust. |
Regulatory variation across cities | -4.8% | North America, Europe, Asia Pacific | Creates compliance complexity. |
Dispute resolution challenges | -4.1% | Global | Impacts user satisfaction. |
Supply-demand imbalance | -3.7% | Emerging markets | Limits service reliability. |
Competition from traditional rental companies | -3.4% | Global | Pressures platform differentiation. |
Recent Developments
May 2026 – GoMore acquired Getaround’s European peer-to-peer carsharing platform, creating one of the largest P2P carsharing operators in Europe. The deal strengthens GoMore’s position across shared mobility, short-term vehicle access, and app-based rental services.
February 2025 – Turo withdrew its planned U.S. IPO and later reduced its workforce by about 15%, equal to nearly 150 employees. The company reported about USD 958 million in 2024 revenue and continued to focus on safety, profitability, and long-term platform growth.
Report Scope
Report Highlights | Details |
|---|---|
Market Revenue (2025) | USD 22.1 Bn |
Forecast Revenue (2035) | USD 829.8 Bn |
CAGR (2025-2035) | 43.7% |
Base Year for Estimation | 2025 |
Historic Data | 2020-2024 |
Forecast Period | 2025-2035 |
Report Coverage | AI market impact analysis, Market surveys, trade analysis, Industry & competitive intelligence, Revenue projections, company positioning, competitive analysis, growth drivers, and emerging market trends, Strategic Consultation & Advisory Services |
Segments Covered | By Rental Type (Property Rental, Vehicle Rental, Tools & Machinery, Others), By Platform Type (Mobile Apps, Web-based Platform), By End-Use (Individual Consumers, Businesses & Organizations), By Regional Insights |
Regional Analysis | North America - US, Canada; Europe - Germany, France, The UK, Spain, Italy, Russia, Netherlands, Rest of Europe; Asia Pacific - China, Japan, South Korea, India, New Zealand, Singapore, Thailand, Vietnam, Rest of Latin America; Latin America - Brazil, Mexico, Rest of Latin America; Middle East & Africa - South Africa, Saudi Arabia, UAE, Rest of MEA |
Key companies profiled | Airbnb, Getaround, Outdoorsy, RVshare, Vrbo, ShareGrid, Zillow Rentals, Fat Llama, Turo, Other Key Players |
Customization Scope | Tailored insights for specific regions, countries, and market segments can be provided. Additional report customization is available upon request. |
Competitive Landscape
The market is characterized by intense competition among established players and emerging companies. Strategic partnerships, mergers and acquisitions, and product innovation are key strategies employed by market participants.
Key Market Players
Airbnb, Inc.
Turo Inc.
Getaround, Inc.
Fat Llama
Vrbo
Spinlister
RVshare
Outdoorsy, Inc.
ShareGrid
KitSplit
Neighbor.com
Boatsetter
Other Key Players
Meet the Team
This report was prepared by our expert analysts with deep industry knowledge and research experience.
Sayali is a Research Analyst with expertise in market intelligence, industry assessment, competitive analysis, and data-driven research. Her work focuses on evaluating market dynamics, growth opportunities, demand patterns, regulatory developments, and strategic business trends across diverse industries. She specializes in market sizing, forecasting, segmentation analysis, regional evaluation, company profiling, and competitive benchmarking. Her analytical approach combines secondary research, industry validation, and structured data interpretation to deliver clear, reliable, and decision-focused insights.
Suraj is a Senior Management Consultant with over 7 years of experience in market research, business strategy, and consulting. He has worked with Fortune 500 companies and growing startups, helping them with market entry, cross-border expansion, demand analysis, competitive assessment, and growth planning. His analytical thinking and strong industry knowledge help clients make clear, confident, and informed business decisions.
Frequently Asked Questions
Related Reports
More in Information and Technology
Operating Room Integration Market to hit USD 10.3 Bn by 2035
Global Operating Room Integration Market Size, Share Report By Component (Software, Hardware, Services), By Device Type (Audio and Video Management Systems, Display Systems, Others), By Application (General Surgery, Orthopedic Surgery, Others), By End User (Hospitals, Ambulatory Surgical Centers, Specialty Clinics), By Deployment Mode On-premise, Cloud-based, Hybrid), By Operating Room Type (Hybrid Operating Rooms, Integrated Operating Rooms), By Technology (Surgical Workflow Integration, Image and Video Integration, Others), By Regional (North America, Europe, Asia Pacific, Others), By Regional Insights, Business plan and Project Report, Investment Opportunities, Profitability, Industry Trends, Leading Companies and Growth Forecasts by 2025-2035
Sharing Economy Apps Market to hit 1,411.2 Bn by 2035
Global Sharing Economy Apps Market By Product / Service Type (Shared Transportation, Shared Space, Sharing Financial, Sharing Food, Shared Healthcare, Shared Knowledge & Education, Shared Task Services, Shared Items, Others), By Distribution Channel (Online, Offline), By End User (Generation Z, Millennials, Generation X, Boomers), By Regional Insights, Business plan and Project Report, Investment Opportunities, Profitability, Industry Trends, Leading Companies and Growth Forecasts by 2025-2035
AI Receptionist Market to hit USD 23.8 Bn by 2035
Global AI Receptionist Market Size, Share Analysis Report By Component (Solutions, Services), By Deployment (Cloud-based, On-premises), By Service Type (Voice Reception Services, Chat Reception Services, Appointment Scheduling, Call Routing, Lead Qualification, Customer Support), By Service Model (24/7 Receptionist Solutions, Business Hours Receptionist Solutions, Hybrid Receptionist Solutions), By Technology (Voice AI Integration, Conversational AI, Natural Language Processing, Speech Recognition and Others), By Enterprise Size (Small and Medium Enterprises, Large Enterprises), By End-use (Healthcare, Legal Services, Real Estate, Retail and E-commerce, BFSI, Hospitality, Automotive, Home Services, IT and Telecom, Others), By Regional Insights, Business plan and Project Report, Investment Opportunities, Profitability, Industry Trends, Leading Companies and Growth Forecasts by 2025-2035
Voice AI Agents Market to Hit USD 113.7 Billion by 2035
Global Voice AI Agents Market Size, Share Analysis Report By Solution (Voice AI Platform, Services (Professional Services(Implementation & Integration, Consulting & Training Services, Support and Maintenance Services), Managed Services)), By Deployment (Cloud Based, On Premises), By Enterprise Size (Small & Medium Enterprise Size, Large Enterprises), By Industry (BFSI, Automotive, Healthcare, Retail & E-commerce, IT & Telecom, Aerospace & Defence, Others (Utilities, Media & Entertainment)), By Regional Insights, Business plan and Project Report, Investment Opportunities, Profitability, Industry Trends, Leading Companies and Growth Forecasts by 2025-2035